Repository Details
Shared by

HelloGitHub Rating
0 ratings
基于 G2Plot 封装的 Python3 可视化库
Past 7 days Received 1 stars ✨
Use arrow keys to explore dates, Home and End for the first and last date, Escape to dismiss.| Date | Star | Daily change |
|---|---|---|
| 周二 | 1,075 | — |
| 周三 | 1,075 | 0 |
| 周四 | 1,075 | 0 |
| 周五 | 1,075 | 0 |
| 周六 | 1,075 | 0 |
| 周日 | 1,076 | +1 |
| 周一 | 1,076 | 0 |
1.1k
Stars
No
Chinese
Python
Language
No
Active
1
Contributors
9
Issues
No
Organization
None
Latest
114
Forks
MIT
License
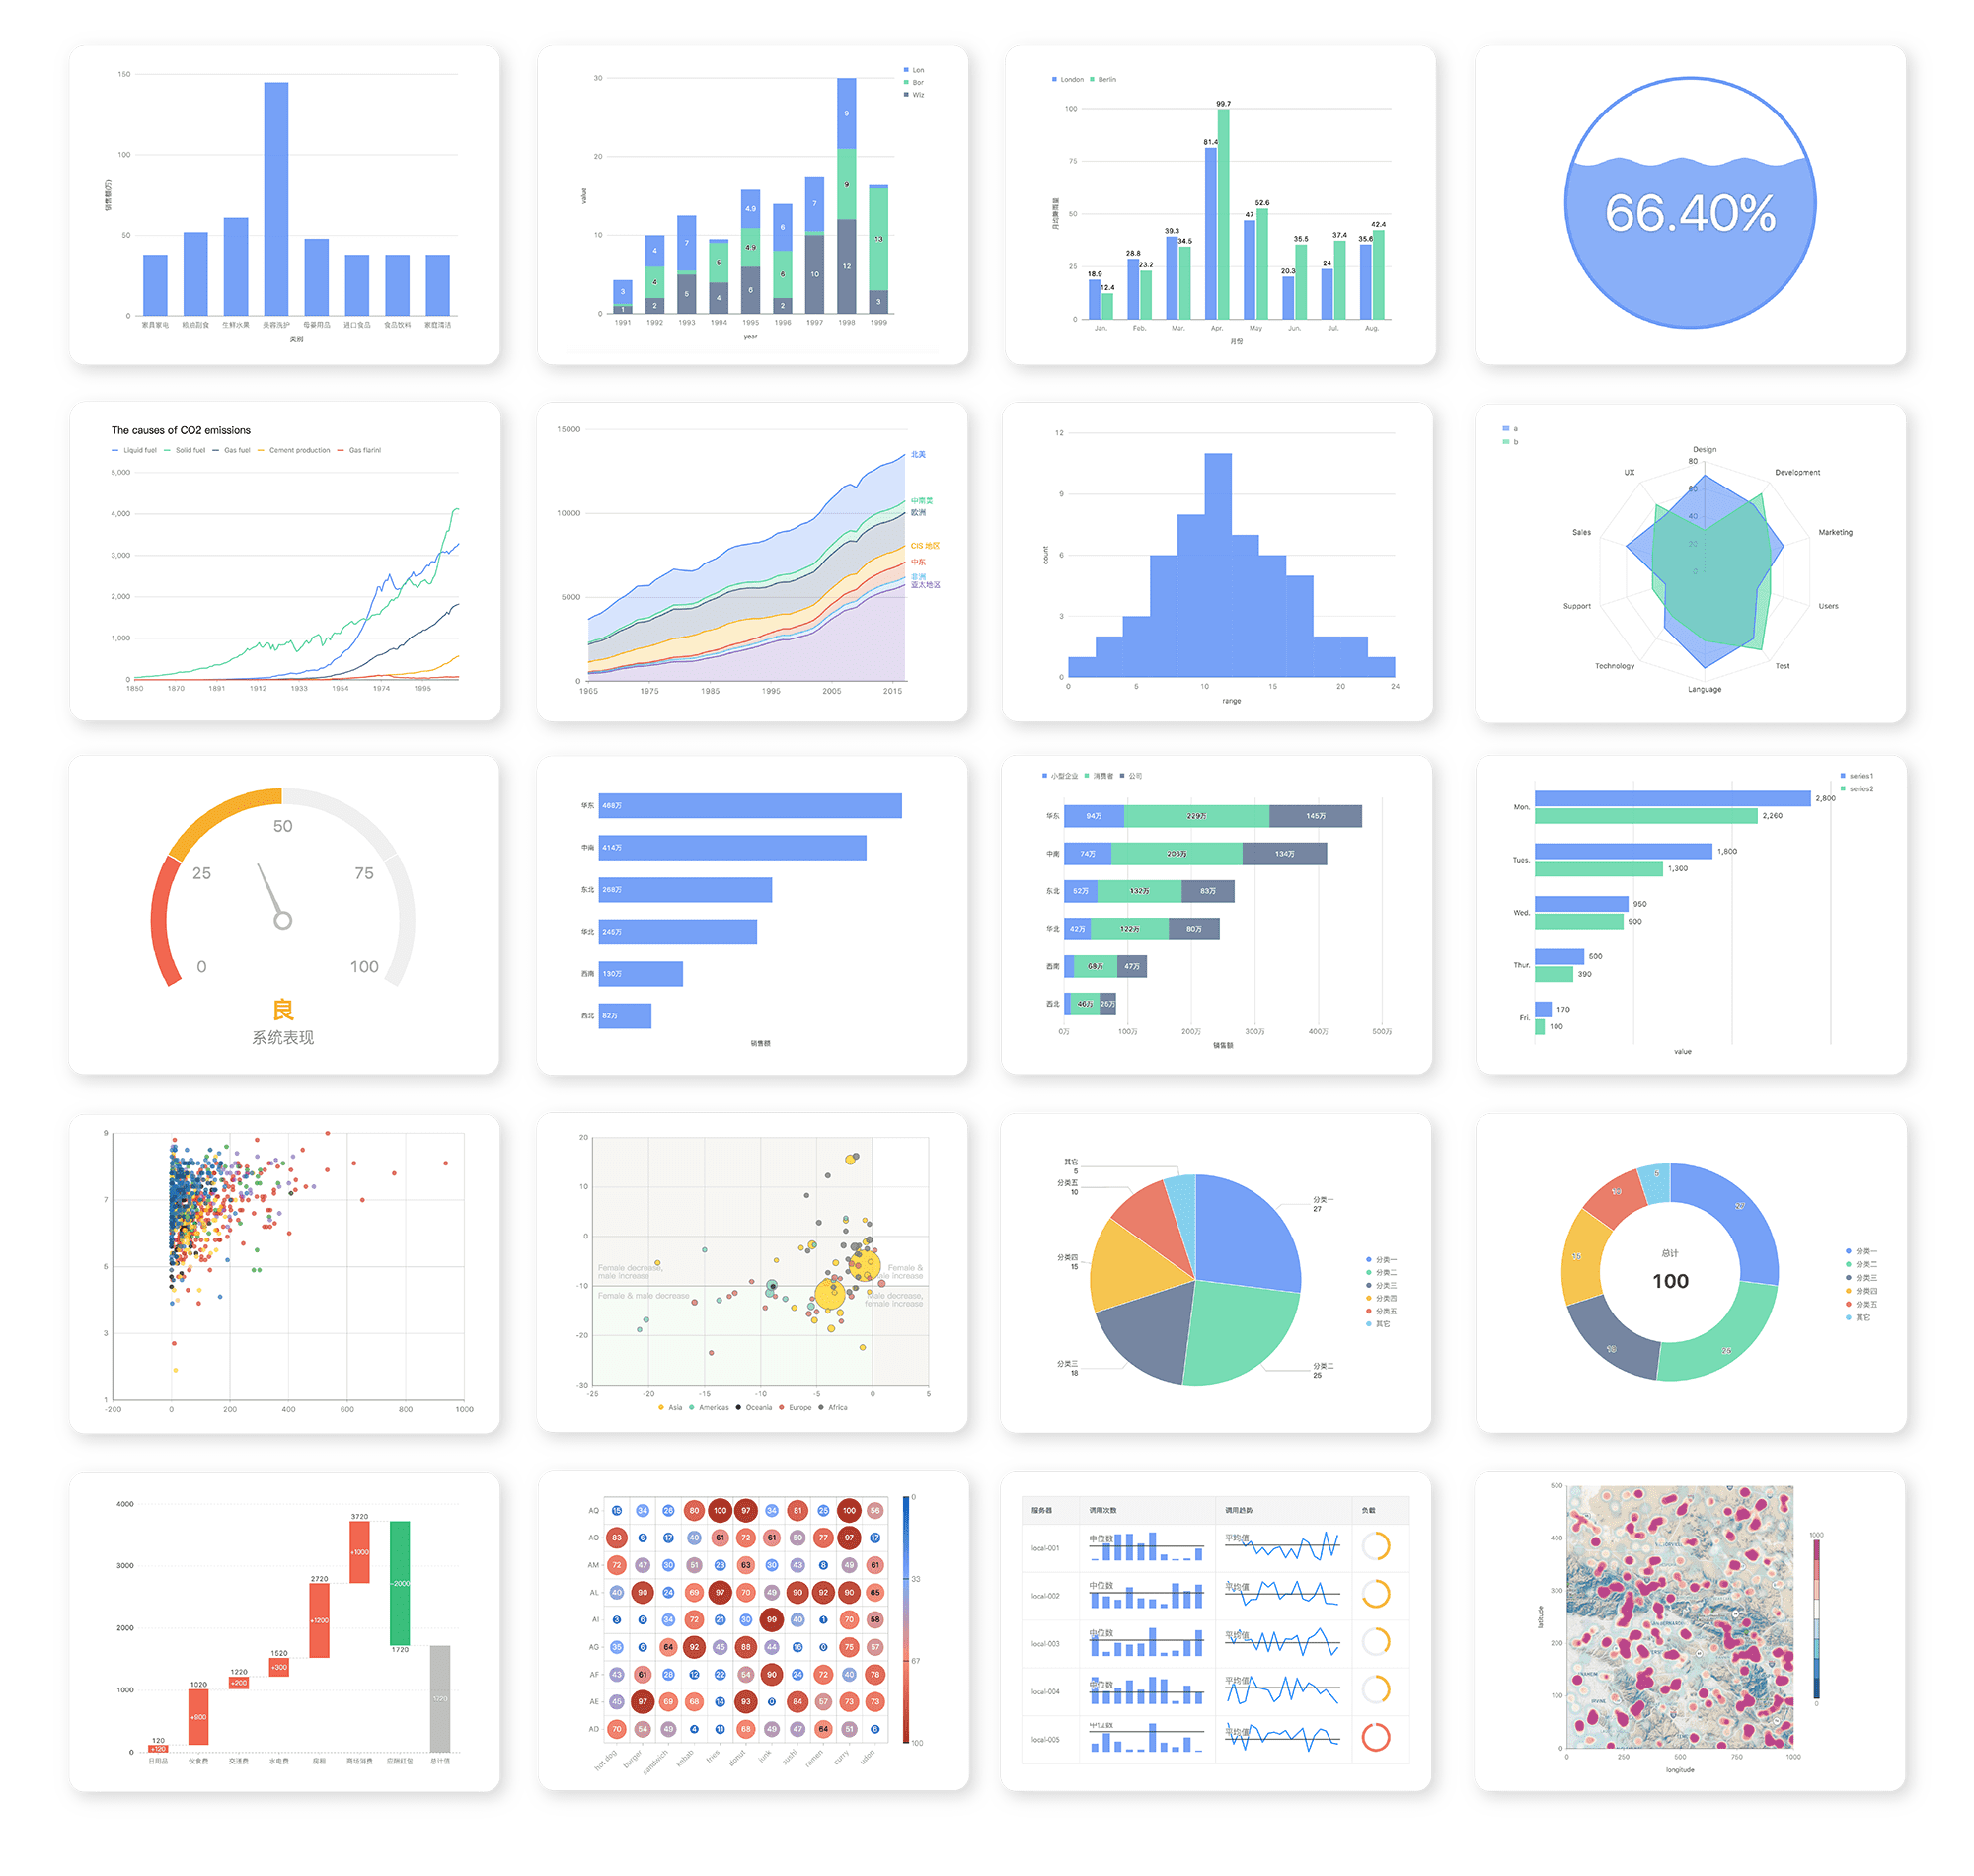
基于 G2Plot 封装的 Python3 可视化库。G2Plot 是蚂蚁集团开源的一个基于图表分类学的可视分析图表库,内置 25+ 常见图表类型。该库是 Python 对 G2Plot 的封装,体验良好,开箱即用
```python
from pyg2plot import Plot
line = Plot("Line")
line.set_options({
"height": 400, # set a default height in jupyter preview
"data": [
{ "year": "1991", "value": 3 },
{ "year": "1992", "value": 4 },
{ "year": "1993", "value": 3.5 },
{ "year": "1994", "value": 5 },
{ "year": "1995", "value": 4.9 },
{ "year": "1996", "value": 6 },
{ "year": "1997", "value": 7 },
{ "year": "1998", "value": 9 },
{ "year": "1999", "value": 13 },
],
"xField": "year",
"yField": "value",
})
line.render_notebook()
```
Comments

Rating:
No comments yet