Repository Details
Shared by

HelloGitHub Rating
0 ratings
强大的数据可视化 Python 库
Past 6 days Received 3 stars ✨
Use arrow keys to explore dates, Home and End for the first and last date, Escape to dismiss.| Date | Star | Daily change |
|---|---|---|
| 周日 | 10,512 | — |
| 周一 | 10,513 | +1 |
| 周二 | 10,514 | +1 |
| 周三 | 10,513 | -1 |
| 周四 | 10,514 | +1 |
| 周五 | 10,515 | +1 |
10.5k
Stars
No
Chinese
Python
Language
Yes
Active
210
Contributors
163
Issues
Yes
Organization
None
Latest
889
Forks
BSD-3-Clause
License
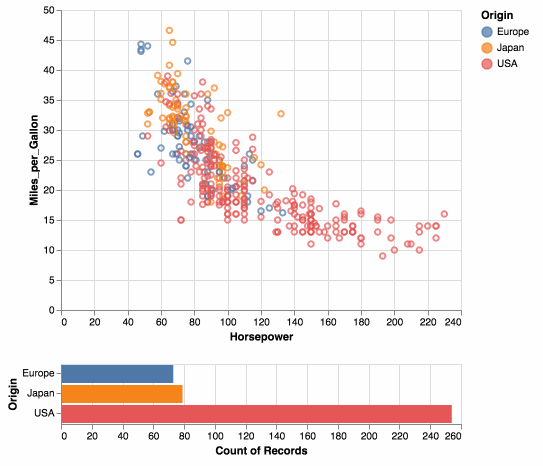
强大的数据可视化 Python 库。支持多种数据展示方式、接口简单、效果炫酷,示例代码和效果如下:
```python
import altair as alt
from vega_datasets import data
source = data.cars()
brush = alt.selection(type='interval')
points = alt.Chart(source).mark_point().encode(
x='Horsepower',
y='Miles_per_Gallon',
color=alt.condition(brush, 'Origin', alt.value('lightgray'))
).add_selection(
brush
)
bars = alt.Chart(source).mark_bar().encode(
y='Origin',
color='Origin',
x='count(Origin)'
).transform_filter(
brush
)
points & bars
```
Included in:
Vol.53
Comments

Rating:
No comments yet