Repository Details
Shared by

HelloGitHub Rating
0 ratings
Command-line Data Visualization Tool Written in Ruby
Past 7 days Received -1 stars ✨
Use arrow keys to explore dates, Home and End for the first and last date, Escape to dismiss.| Date | Star | Daily change |
|---|---|---|
| 周二 | 4,877 | — |
| 周三 | 4,877 | 0 |
| 周四 | 4,876 | -1 |
| 周五 | 4,876 | 0 |
| 周六 | 4,877 | +1 |
| 周日 | 4,876 | -1 |
| 周一 | 4,876 | 0 |
4.9k
Stars
No
Chinese
Ruby
Language
Yes
Active
11
Contributors
13
Issues
Yes
Organization
None
Latest
72
Forks
MIT
License
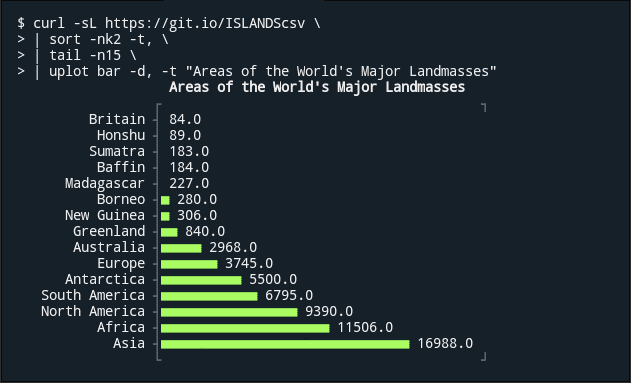
This project transforms data into colorful charts within the terminal, supporting types such as bar charts, histograms, and box plots.
Comments

Rating:
No comments yet